Tuesday, November 15, 2011

Rangebound for a month, resolution soon

We have been rangebound for nearly a month.  I expect a resolution by the end of this week/early next week.  Whether Santa Clause shows up or not will most likely be determined by the Euro.  If the Euro/USD cross breaks 1.31, I expect SWHTF.
Breaches of 1292 to the upside and 1226 to the downside are easy lines in the sand.  Both have merit, but I would expect the Santa Clause rally to not start before an intermediate pullback........and the surprise may be that he doesn't show up this year.


As far as the full meltdown scenario goes, I will stay silent until we get back under 1100.  Current European news and spreading civil unrest may back my claims.  Unemployment near 18% and food stamp use near 20% would not normally point to "green shoots."  Unfortunately for me, the time factor and the Federal Reserve/IMF tricks are quite difficult to predict. 

Wednesday, October 12, 2011

Ruck is getting cute again. Another top must be close.

The Santa Clause rally is showing up two months early this year.  I wasn't expecting to be at these levels until the end of November.  Earnings are expected to hit record levels this quarter.  Oddly they will be doing so during a global credit meltdown.

My current target on the upside is the 200 day moving average, or around 1270.  This coincides with around 12,000 on the DOW.  I have plotted how this move might look over the next two months, minus global events truncating it early.

I believe 1220 today was an excellent short location.  I believe 1240 will be a great short in about 2 weeks, and 1270 mid November would be a gift.  This move should definitely be the last hoo-rah.


Monday, October 3, 2011

Last Chance Gulch (Economic Meltdown Incoming???)

Last chance gulch at S&P 1120.  The Euro just got flushed down the toilet and copper got absolutely hammered.  Bonds and Treasuries still disagree with equities and things are about to get very interesting globally.

I can't believe the occupy wall street movement is still going on.  I guess you can't keep our youth unemployed as corporate profits rise to all time highs.  The percentage of disparity between the rich and the poor, before a revolution starts, would be interesting to guess at.

The real question people are wondering is if Greece will default this week.  It may be time.

Thursday, September 29, 2011

Props to Nick Wilson for his NFLX call

Props Nick.  Look at the NFLX slaughter fest.  Good call.  Crazy to think it isn't done.  :/


And to think this is just the first of many.  Wait until Apple turns everyone's faces.  Even I will have a hard time believing it's correction when it happens

I think we see more follow through to the upside this next week.  The only thing that could convince me otherwise is a breach of 1140 to the downside.  I have no clue how someone could hold long on stocks, through a weekend, in this global climate.  cRaZy

Sunday, September 25, 2011

In times of universal deceit.....

In times of universal deceit, telling the truth becomes a revolutionary act.--George Orwell


Bouncing around 1100 is nothing more than a flip of the coin this week.  We either crush it drastically or we bounce for another week+ of delay.  Nothing will change the endgame though.  We are heading to 1040.  Monday should quickly define our terms.

Watch for the Dollar to rally this week, gold to continue being crazy, and Europe on continuation to implode.

Thursday, September 22, 2011

Last Chance Gulch (S&P 1150 needs to hold here)

The S&P futures will have to do an awful lot of work before 6:30am, if they want to hold the 1150 support line.  I believe the liquidity in the private credit market just ceased, thanks to the Bernank.  The news is rolling across Europe right now and their markets aren't looking too happy.  This could pick up momentum before morning.
I have the next S&P support line at 1040.

Cash will be king!!  Look at that dollar surge.  The US Dollar is probably the safest place for your holdings.  Imagine investing by doing nothing?  Easy Peasy.  Imagine how strong the US Dollar will become if Government is silly enough to confisicate Gold again like they did in 1933.  OMG!!

The bright side:  Gas might stay under $4 gallon if the dollar continues to strengthen and our economy finally allows deflation to run its course.


Monday, September 19, 2011

Sunday, September 18, 2011

Inevitable Delayed...........yet again

We continue to remain rangebound. This rising channel has morphed into a flat of one degree higher than originally expected. This could extend the time duration of this pattern by as much as two weeks, which means it should probably resolve by October 4th.

Rising channels are Bearish distribution patterns. It should be interesting to see if large corporations can distribute their shares to Joe Public the next two weeks, or if global affairs will help truncate the distribution of these shit sandwiches.

To keep it simple:

S&P sell if below 1180
S&P buy if above 1260 (you wont see me doing it, will cover though)

The US Dollar is finally showing strength. YAY!!! About time after a four year bottoming/consolidation pattern. The pattern on the USD's breakout looks legit and Bullish. The time on the Euro is ticking. I was originally telling people that the Euro would be gone in 5 years. At this point, I wouldnt be surprised to see it gone in less than 3.
This is where it gets very interesting, and possibly humorous. People talk about magically taxing the wealthy. Good luck getting at their cash. The minute a Bill is passed to tax millionaires, they will liquidate their assets across the board, pay their capital gains taxes, and put their money into stable assets that will be untouchable. What will be left is a cratered securities and commodities exchange. As taxes are increased you will see less people selling their assets and less people claiming their capital gains. A new tax plan is the end of the game for Baby Boomers.   They win if they liquidate. And cash will be king.

....unless of course, the Fed finds another method to magically inflate this deflationary spiral of death. I think the Bernank has his back against the wall though.

Sunday, September 11, 2011

Dollar Break Out Deflation Incoming

The dollar has finally broken out and may signify some serious deflation ahead.  I see the following happening on the following time scales:

  • All week                      A significant week of selling if we pass below 1150 on the S&P

  • End of Month              Selling into the beginning of October getting as low as 1040

  • October/November     Recovery Rally to 1240 area.  Just under Dow 12,000 for our Dow theorists

  • End of Year                Selling into 2012

  • Next year to May       This is going to be one hellava rollercoaster ride.  The Bull/Bear fight will be left unresolved

  • Latter half of 2012      = Fail


Monday, September 5, 2011

Happy non-labor Labor Day

Nice August print of no jobs created.  First time since 1945.  This is all playing out like a bad movie.  There is no circumventing a global credit collapse.  Strap your seat belts on and keep what is left of your dignity.  Take the finger you are pointing and point it at yourself.
Real money returns to the market after labor day.  Their votes will be cast this week and next and should define where the markets will be going.  A quick glance today shows that they are fleeing to safety in the US Dollar, Gold, and Treasuries.  If that continues, we can all assume what will happen to equities.

There are three important levels this week.  They are 1140, 1120, and 1100.  It would surprise the heck out of me if one of these levels did not induce some buying into Thursday.  By Tuesday of next week we should know the direction we are heading into October.

Tuesday, August 30, 2011

Nothing Important until 1260+ or 1100-

We are rangebound until 1100 or 1260 are taken out.  We are approaching overbought on the short-term outlook.  Overbought could very well extend through the end of next week.  Volume is dropping with the short term new highs, which shows weakness.

An intermediate top near 1260 is expected.

Thursday, August 25, 2011

International Space Station Viewing (Seattle evenings)

It is a perfect week to view the International Space Station from Seattle.  It is as simple as going out just after sunset, staring up West, and watching it path over your head to the East.

Attached are the ideal times.  It looks like Monday evening is going to be the most ideal, weather dependent.

http://www.n2yo.com/passes/?s=25544


A good portion of non-military satelites can be tracked at:
http://www.n2yo.com/

Set your date preferences and your location, and boom it calculates orbits for you.  I have always been interested in space.  The first time the International Space Station was pointed out to me was 4th of July in Missoula, Montana.  It was so amazingly clear we could actually see the Soyuz rocket on an approach path behind it, making its docking descent.  Amazing.  My uncles still marvel how crazy it was to see Sputnik the first time. 


Enjoy!   No technical analysis this week.  ;)

Sunday, August 21, 2011

Official Bear Market at a 20% or Greater Correction (sub S&P 1096 or DOW 10320)

Everyone knows it is coming.  The market action will only display the consensus of their sentiment.
It is an important week for stocks.  A Bear Market officially begins when a 20% or greater correction takes place.  The line in the sand becomes the S&P 1096 or the DOW 10320.

As far as Elliott Wave theory goes, third waves are recognition waves.  They are found at locations when people start believing differently about their current situation.  I think it is very possible that "recognition" shows up this week.  The theory points to a situation when sentiment immediately changes.  In markets, it usually occurs over night and is blamed on some global issue.  The "real money" trades futures all night.  When a six sigma event (or Black Swan) shows up, all high frequency traders hit a no bid situation.  The futures are driven down all night, and the panic spreads at the market open.  They are found at large gaps in the market that usually arent filled for very extended periods of time.

European and Asian markets have officially entered their Bear Markets.  Monday or Tuesday could be our catch up morning.  The dollar looks like it is about to surge.  If we breach the lines in the sand, I would expect a flight out of securities and into the dollar and treasuries.  Imagine a strong US dollar?    Without a strong dollar there is significant problems with our treasury and bond sales, which means are borrowing/debt game is over.  Our Federal Reserve mistakingly continues to keep interest rates artificially low.

Look for these locations to be breached.  If so, they are a DOW theory SELL signal.

Wednesday, August 10, 2011

For Perspective: The DOW from 1900 to present

Noting 100 years of stable linear appreciation, on a logarithmic chart, one can quickly see where we reside from the mean.


Destroying the dollar would be the only way to keep prices in this vicinity.

Tuesday, August 9, 2011

15 Month Bear Market ???

A drop of more than 20% suggests we have entered a Bear Market.  This morning we bounced quite near that 20% correction mark.  The previous Bear Market in 2008 took 15 months to complete.  In corrective markets, time appears to govern over price.  Knowing this, I believe this leg down will also take 15 months to complete.  It will look somewhat symmetrical to the ride up, but it will be shorter in duration, therefor have much steeper looking moves.

Pegging a price for the low in October 2012 will be near impossible for me at the moment.  Levels of sentiment and the magnitude of the lies will determine how deep this rabbit hole goes.

I do not see us getting back above S&P 1240 for multiple years.  If this next leg up pushes me out of my position at 1250, I will pack up for a considerable amount of time.

Here is my charted long term outlook.  Sentiment, global credit insolvency, and lack of Government direction, suggests the analysis is correct.


Monday, August 8, 2011

A Tuesday Stock Market Crash is on the table (torches and pitchforks if QE3)

It appears if institutions sold hard today.  Volume was very high.  I expect that the retail (home) investor went home tonight and might panic tomorrow in a capitulation sell off.  There is also and FOMC meeting, that could turn around this market on a dime, with the announcement of a Quantitative Easening #3.
They have definitely set the stage for QE3 to sneak by everyone.  With the debt ceiling discussion and the market sell off, people are going to be more apathetic accepting an inflationary QE3.  If QE3 is passed, it is another attack on the poor, with inflationary measures that protect the rich.

Say "No" to QE3.  Everything else is grand standing to push this one by you.  America will once again be robbed by our Federal Reserve.

Attached is my final count of the market top, both on a short time frame and on a three year time frame.  I believe we have definitely started the next bear market.  This one should just about crush everything and everyone.

If we crash tomorrow, we should get a very very hard bounce off the 1000 mark on the S&P.  Should be quite a rollercoaster tomorrow.  :/


Sunday, August 7, 2011

Point Of No Return? (credit systems will always fail)

We are quickly approaching my beary beary Big Bear line of 1140.  At that location I think we start ripping through some serious stops, margin calls unzip, and banks start having difficulties loaning again because of asset/collateral depreciation.  A breach of 1140 would make me believe that the 2+ year rally is now over.  I would become more Bearish here, if one could believe that.  :P

I honestly can't pin down what occurs Monday.  The currencies will lead the show.  I honestly don't know if the S&P downgrade will strengthen the USD or weaken it.  If it weakens it, we could actually have a significant market rally from this location.

Below are my charts from:
3-25-11
3-31-11
4-10-11
4-18-11
These are excellent to review to see how they turned out.  I am still undecided if the technical top was early May or in July.  It will affect my count in the future.  If we breach 1140, I will start counting internal wave structure again to see if I can locate where it will bounce.  I would not be suprised to see it bounce exactly on 1140.  Once  a bounce occurs, I will be able to dial in exactly how big this move will be.  First guess is 2008 was A down, the last 2.5 years were B up, and now we are beginning C down.

Overall, a couple of my ideas/counts came pretty close.


Thursday, August 4, 2011

Tuesday, May 24, 2011

The Razor's Edge (S&P 1300)

We are tip toeing along The Razor's Edge this week. It can be seen as the red line in my charts. If we break the S&P 1300 to the downside tomorrow, the damage could become severe. A close below 1290 should assure more downside.


The first two charts depict such a scenario. The last chart depicts a close above 1300.


Friday, May 13, 2011

Pondering Space and the Doppler Effect/Red Shift

I had some random thoughts about our Universe when I got home from work. Enjoy!

What if the Universe isn't expanding at an accelerating rate? What if our Galaxy is currently undergoing an ever increasing mass as our Galaxy is cannibilizing and consolidating another galaxy near it's edge. As the center of our galaxy grows in mass, the fabric of space-time becomes more and more disrupted. As this singularity grows in mass at an accelerated rate, the distance across the fabric of space-time appears to be growing at an accelerated rate as well.

Thus making everything outside our Galaxy look like it is moving further and further away from us.

Thus making every Galaxy that is consolidating look like it is moving further and further away from each other Galaxy.

Monday, May 2, 2011

Scheduled turn between 1360 and 1380

I have a scheduled turn between 1360 and 1380 in short time. Two of the ideas have remained unchanged for a month and one of those original ideas has been slightly modified.

Technical Analysis only please. I will post economic ideas later, including oil, gold, and SILVER.


Sunday, April 10, 2011

Chicken Bones and Entrails

The only safe play I see right now is selling hard through a breach of 1250. It is very probable that we are range bound until June. I can see this quarter seeing a significant amount of Options, both PUTS and CALLS, expiring into worthless pieces of paper as the Theta is burnt to a crisp. I imagine this will be the option writer's last season with a major killing, for a very long time.

Thursday, March 24, 2011

Another assault on new highs ???

S & P 1280 appears to have held. The way in which it did so was quite odd. And it did so at a point where it appeared like the whole world was falling apart. The move off the 1250 shows strength, strength that I don't understand and strength that I refuse to touch. ........so more waiting. Zzzzzzz So more top calling from me in the future.

Colleagues and I have 1350 as our next S & P target, and it should be rather quick.(less than a month) Tomorrow or Monday we expect a "gap up." A gap up over the 1310 marker will verify this smaller degree of the count is correct. (Wave 3's are recognition waves, waves that make you say "Oh Boy" are easier to recognize than explaining the math behind them)

A large amount of volume poured in at the end of the trading day. A Big Player knows something and is front running it. I have no clue what it is yet. Wonder if it involves discussion about a Quantitative Easening #3 and a further slaughter of our US Dollar.

My only play right now is sell through a break down of 1280. I'll treat the move towards 1350 as a fireworks show and nothing more.

Sunday, February 27, 2011

Fraud: Washington State Bill SB5272

Non-technical special, from Karl Denninger:


In Washington State there is a bill pending, SB 5275, which has as its title "Protecting and assisting homeowners from unnecessary foreclosures." However, buried in the text of the bill is the following:

7 (a) That, for residential real estate property, before the notice of trustee's sale is recorded, transmitted, or served, the trustee shall have proof that the beneficiary (bank) is the owner of the promissory note or obligation secured by the deed of trust. A declaration by the beneficiary (bank) made under penalty of perjury stating that the beneficiary (bank) is the actual holder of the promissory note or other obligation secured by the deed of trust shall be sufficient proof as required under this subsection.

What's the significance of this section? Simple: No proof need be offered that the bank actually holds the note or obligation. A simple declaration that they are in possession is sufficient. If you're in possession of something as simple as a piece of paper, why would not present the actual paper to the court? There's only one reason to "declare" rather than "prove" - you don't have it.

This bill before the Washington State Legislature explicitly permits the filing of perjured documents and the ejecting of homeowners into the street through fraudulent foreclosures. That which has been bad will, if this bill passes, become even worse. Remember from the above: 150,000 counts of perjury, zero indictments. One can only assume that lying about having the loan document will be prosecuted just as often as lying about reading the papers one submits to the court. That is, never.


In summary, the banks have bundled up these deeds of homes into various investment vehicles and have sold them off numerous times. Banks can no longer track down the physical deeds that are required by law in the event of a foreclosure.

Tuesday, February 22, 2011

Glimpse of Reality ???

Will the people of the world continue to notice the implications of Global Insolvency this week? My guess is people will wake up to more chaos in poorer nations and that the problem may come home to roost in the US, with State Governments also becoming insolvent. What it does to the Global Economic Markets is left to be seen. God knows I am surprised they have held up this long!!!


Interesting actions in the futures and currency markets tonight, with a sell off in the futures and the EURO actions becoming violent. The Gold line that depics the 8 month trend still has yet to be broken. Stuff won't get too interesting until the 1300 marker is broken on the S&P, as marked by the oval. The gap down in the morning should at least make things interesting. I will keep my eye on Apple to see if the building is truly burning.


Friday, January 28, 2011

Intermediate Top Is In

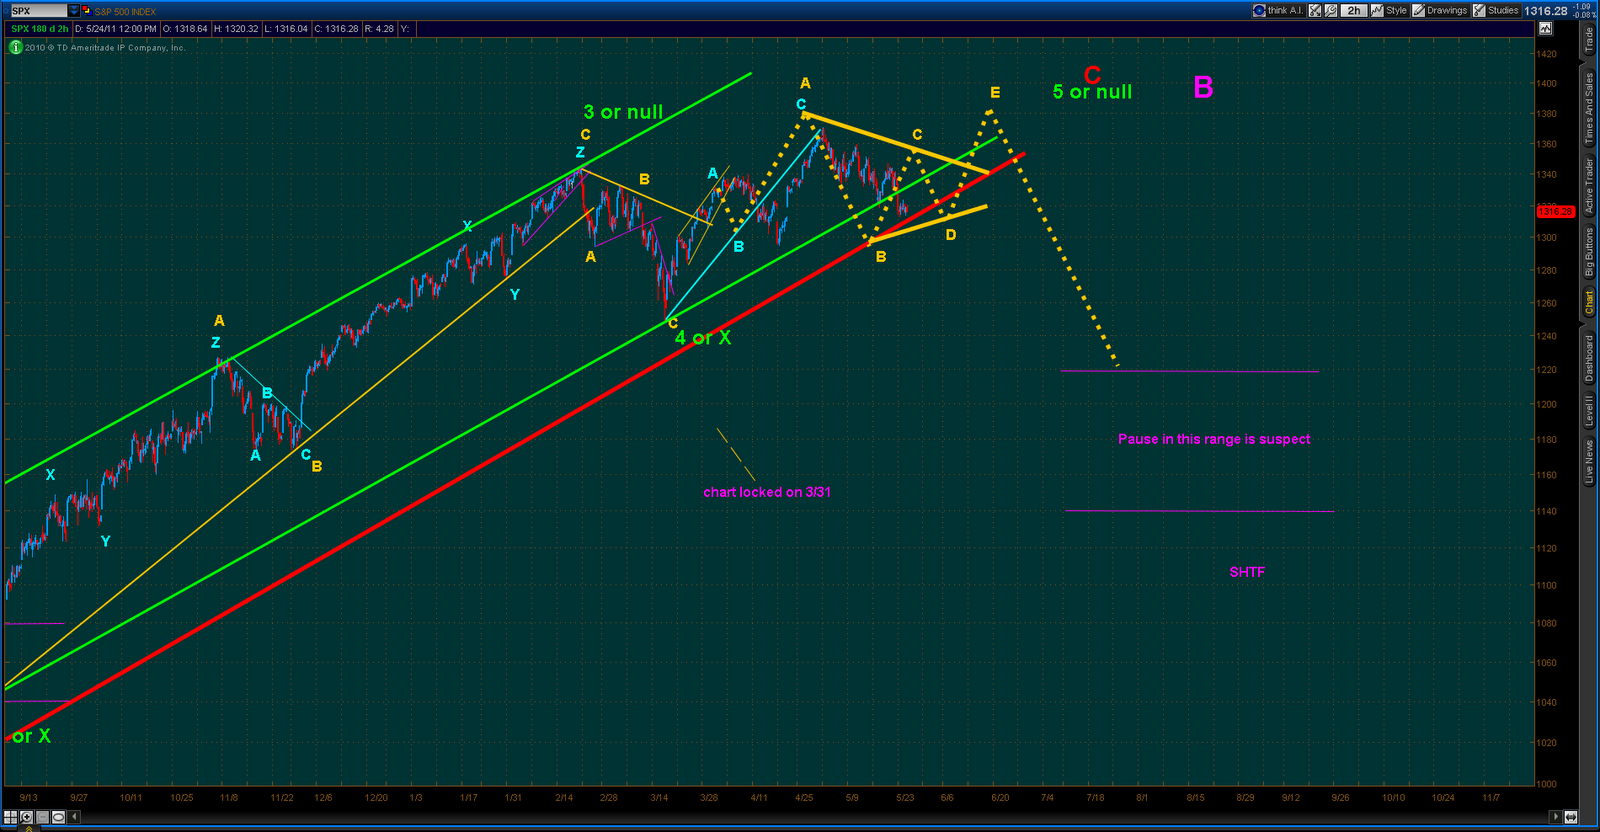
I can almost comfortably say that after today's move we are done. It is not official until the yellow line is broken in the attached chart, but I really like my chances. I expect it to be broken on Monday's open. (I was only 1 day off on my turn date.)

Waiting for a pattern to show up such as this, has really been boring the last 5 months. This is called an ending diagonal and it is a terminal pattern. To verify it as such, it must retrace the whole pattern's move in less time than it took to make. (I would expect the full retrace in a 1/3 of the time)


Around the world SHTF once again. Fundamental traders will point to the last crash being caused by Greek riots. This one will be pinned on Egypt's riots. The charts tell me that these moves are inevitable. The Kingdome is broke and all our emporers have no clothes. I think most people have that nudging feeling in the back of their heads that things aren't as they seem, and will most likely get worse, much worse. The charts tell me that nudging feeling is justified.

In a manner similar to the end of August, I will be focusing my attention on the confluence area between 1120 to 1200 to determine if we have truly terminated the much larger move.


I believe we still reside within the last Hindenburg Omens confirmation. Probabilities are as follows:


A move greater than 5% to the downside after a confirmed Hindenburg Omen was historically 77% within 40 trading days.

The probability of a panic sellout was 41% within 40 trading days.

The probability of a major stock market crash was 24% within 40 trading days.


Like the last Hindenburg Omen showed, these are probabilities. The last intermediate top did satisfy the 5% decline, but it was not The Big One I have been hunting for.

Monday, January 10, 2011

We are approaching an Intermediate Top

When 1040 S&P held, I knew to watch for more upside. I knew it was going to take some time to find a new recognizable pattern, just didnt know it would take the rest of 2010. No way did I believe we would be putting in new highs. Wow!! Grats Cooper for his winnin bet. His prognostication definitely conquered mine in 2010.


The pattern shaping up now is a 5-wave ending diagonal. This pattern is pretty reliable. I have the intermediate top between here and 1300 before the end of the month. The way I will confirm the move is over, is by a break of the yellow bottom trendline. I can't nail down the exact time and date much better because the internal wave structure on the smaller time frames is unlike anything I have seen.


This area probably marks the 7th top call I have had in two years where I believe a stock market crash is possible. A second Hindenburg Omen was triggered a couple weeks ago as well. The one that no one believes in just might be the one that gets em.


Some people believe we are recovering. I am definitely not one of those people.